Goal: Seeing your average network and server times can give you insight into the activity on your website. Here we'll set up the Evolution of Page Performance Metrics widget on your dashboard so that this info is easily accessible to you.
More...
Login to Agency Sonar.
1. On the top of the screen click on ‘Dashboard’.

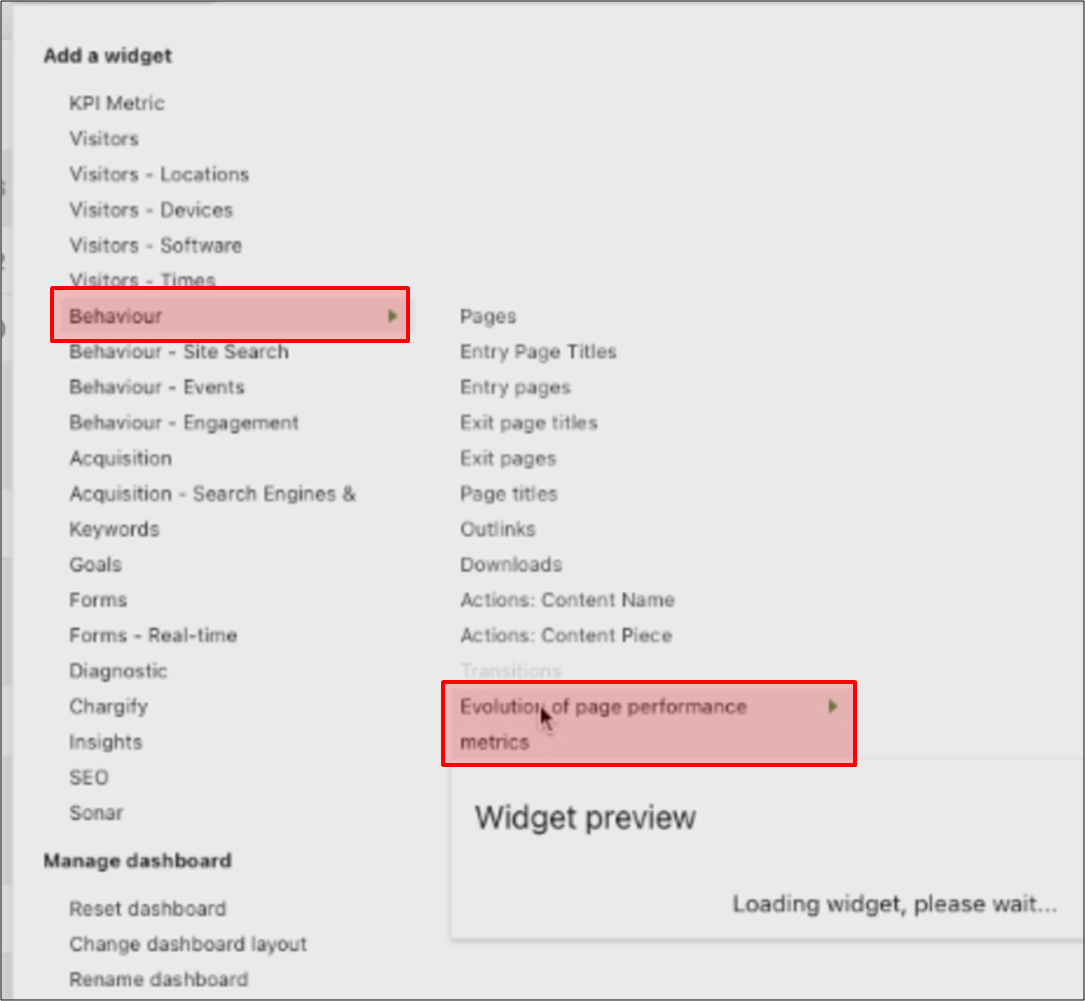
2. Go to ‘Behaviour’ > ‘Evolution of page performance metrics’.

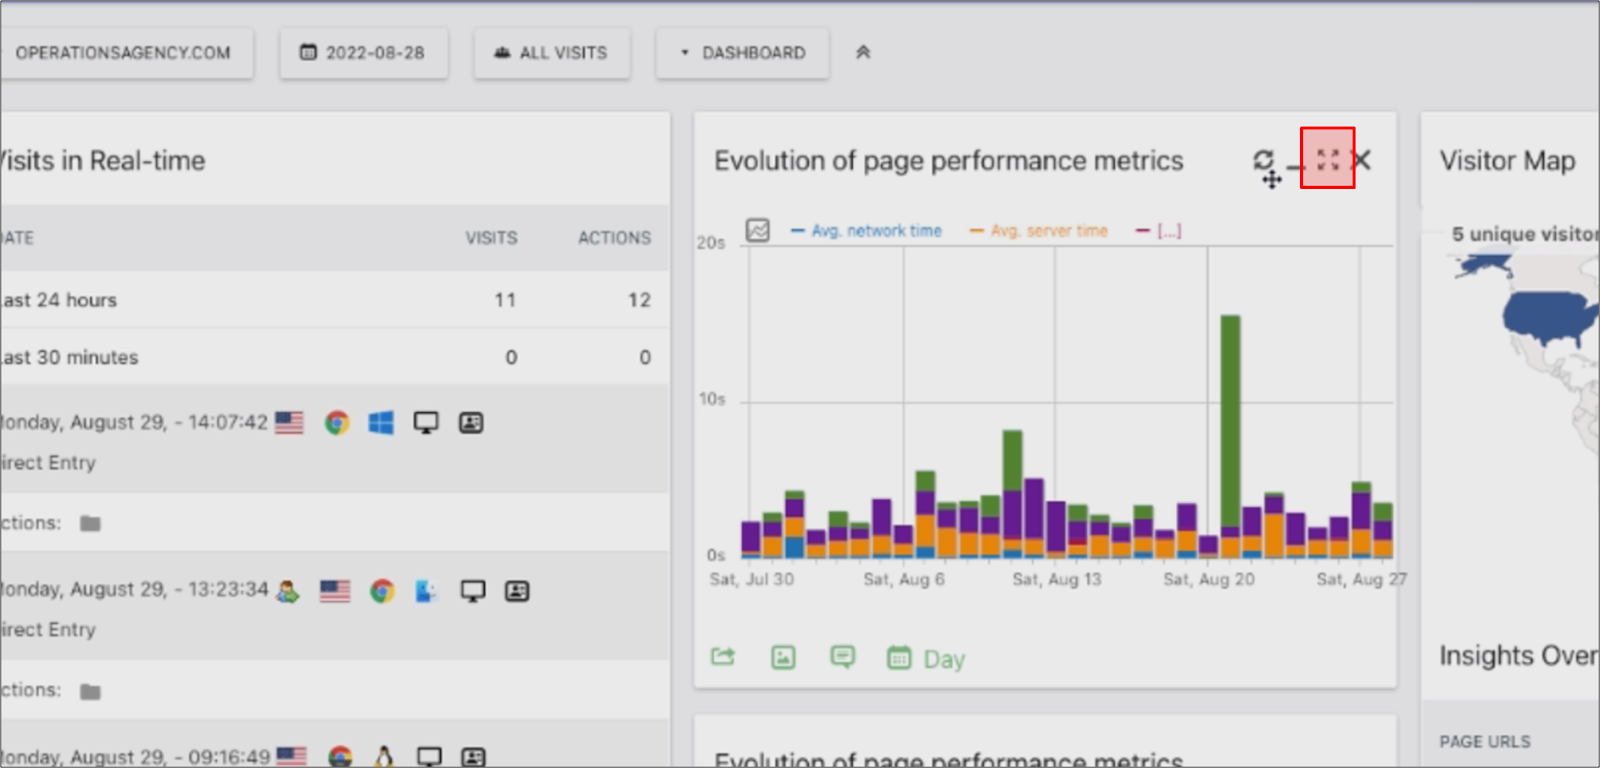
3. The widget can then be moved in your dashboard by clicking on the ‘Move’ icon and dragging it around.

How do I know when I'm finished?
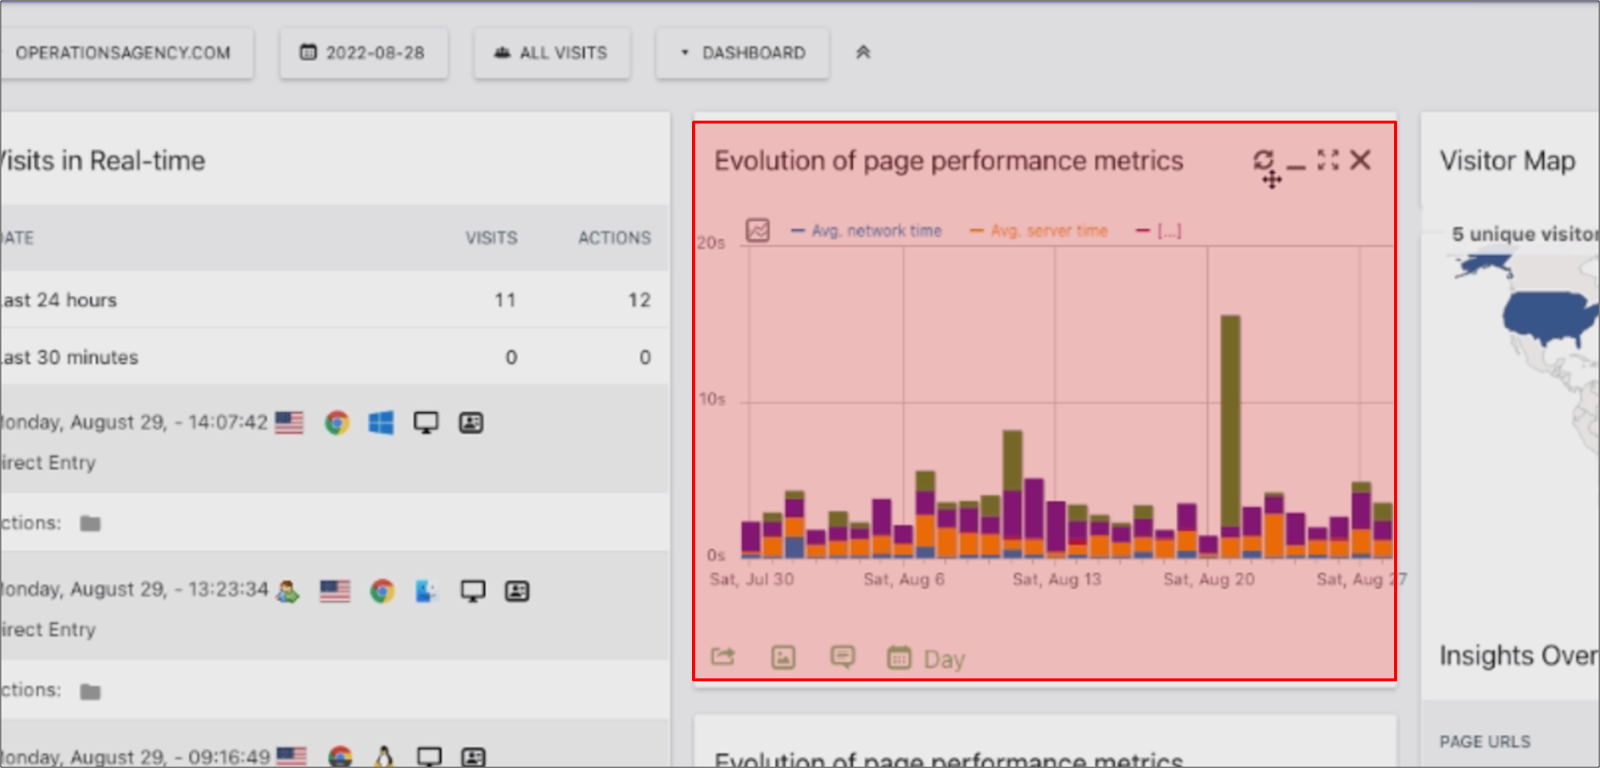
1. The evolution of page performance metrics widget has successfully been added to your dashboard.

