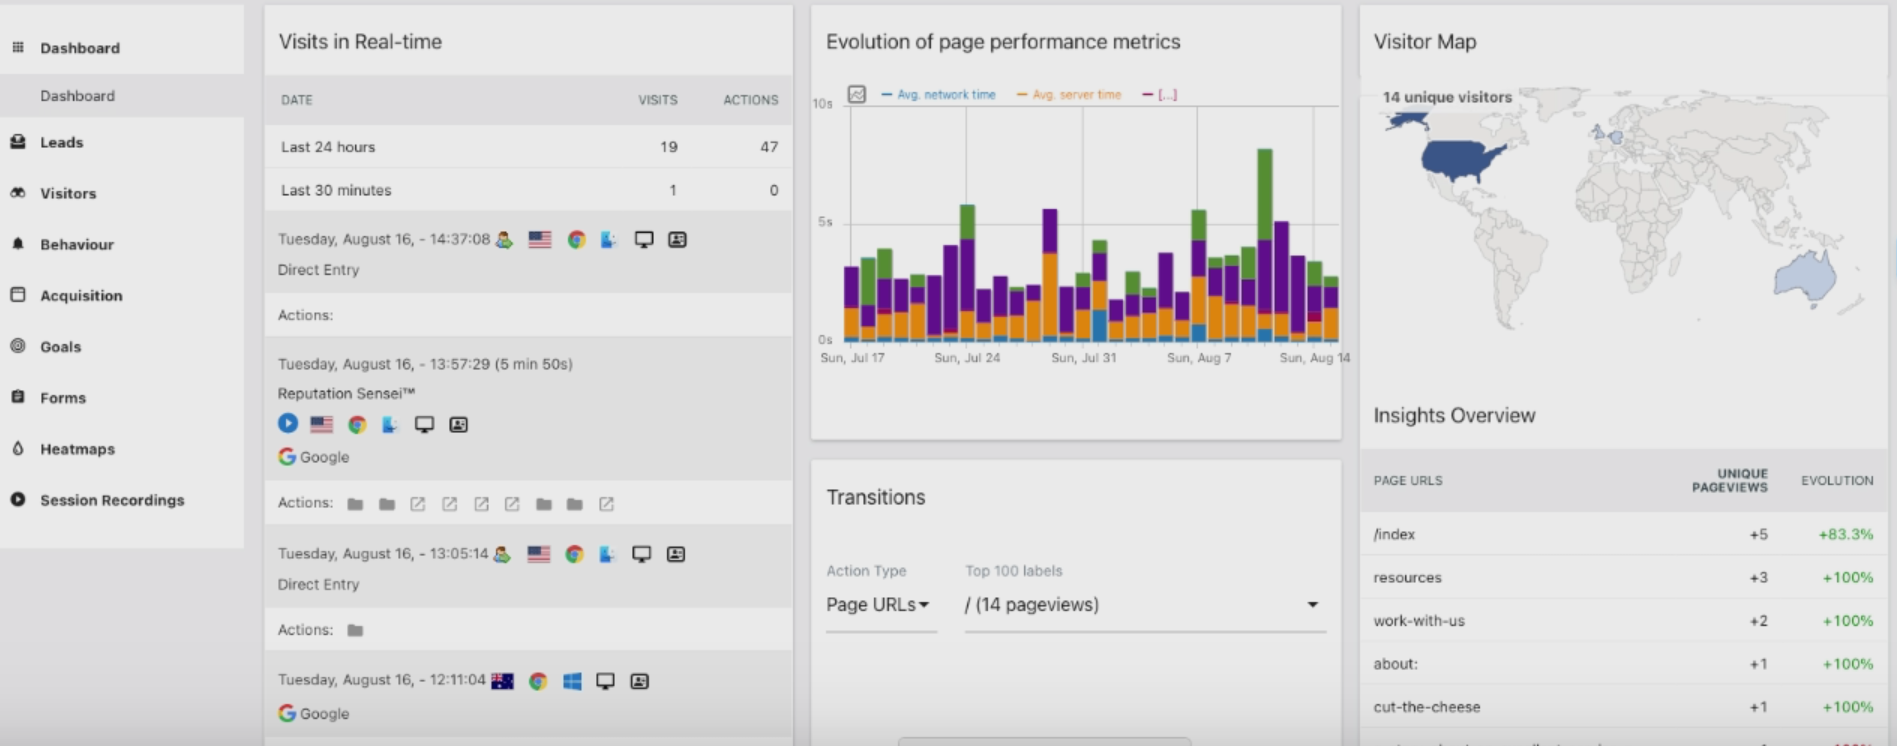
Goal: The goal here is to learn more about what is available to you in your dashboard setup. There are a variety of widget options that can pull a wide range of data from your site to help you figure out what is working best and make informed decisions.
More...
Login to AgencySonar.
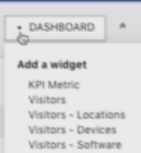
1. When you go to ‘Dashboard’, you can add any of the widgets at your discretion by selecting them from the drop down menu.
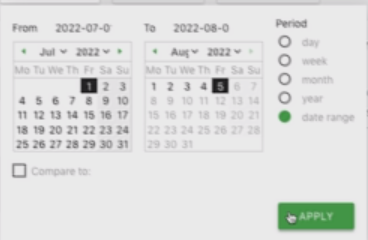
2. In the calendar section, you can enter the period you are interested in and click on ‘Apply’.
3. When you scroll down, you will have Visits in real time, a Visitor Map, and the Visitor’s overview in the default dashboard.
4. Under the Visits in real-time section, you will be able to see recurring visitors, where they are from, as well as their profiles.
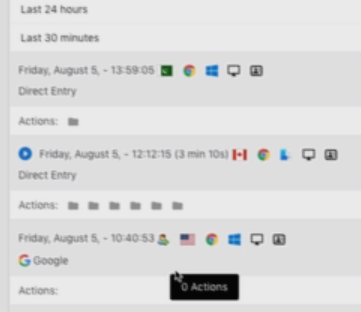
5. When you click on an area in the Real-time map, it will highlight the above information on the left side of the dashboard.
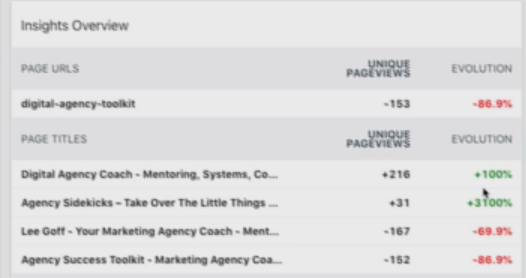
6. Under the Insights Overview section, you will find the top performing URLs along with their evolution. You can also see Downloads as well as other websites.
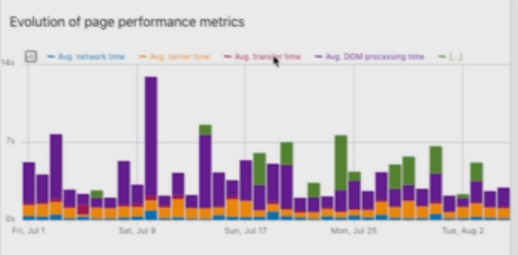
7. The Page Performance Metrics shows your network time, server time, transfer time and down processing time. These metrics are critical in helping you understand how fast your website is running.
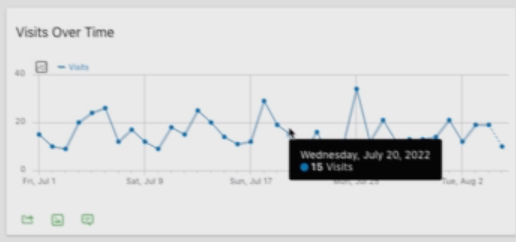
8. The Visits Over time shows the spike or fall of visitors after a certain period of time.
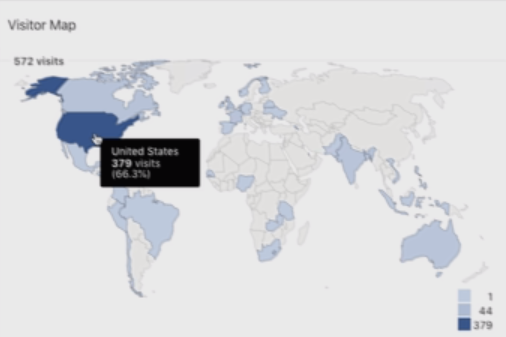
9. The Visitor Map shows where most of the traffic is coming from.
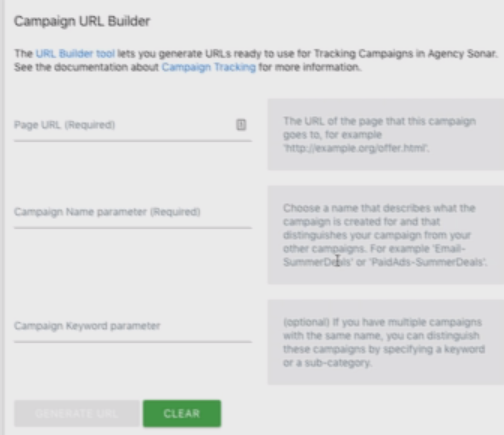
10. The Campaign URL Builder is essential in helping show transitions through your site, how many actions they are taking, and providing transparency into how people interact with your stuff.
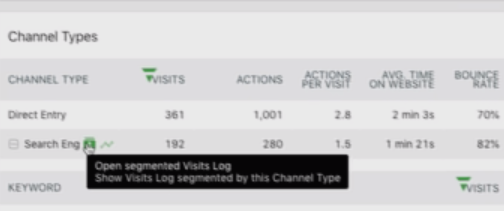
11. The Channel Types show the number of visits, actions, actions per visit, time on the site, and bounce rate for different channels.
How do I know when I'm finished?
1. You have selected a variety of widgets that pull information best suited to your needs. It is also good to have a general idea of what other widgets can offer so that your dashboard can be customized at any time!
